Sales dashboard created with Infragistics NetAdvantage Ultimate.Infragistics NetAdvantage Ultimate 2010 Vol 3 includes all Infragistics ASP.NET, WinForms, Silverlight and WPF controls.
Infragistics NetAdvantage Ultimate provides developers with flexible, advanced controls to rapidly build and style high-fidelity line of business application user interfaces. NetAdvantage Ultimate also includes rich data visualization controls for Business Intelligence applications. NetAdvantage Ultimate includes components for every .NET platform - Windows Forms, ASP.NET, WPF and Silverlight. With Infragistics Ultimate developers receive every control (data grids, trees, ribbons, toolbars, tabs, calendars, editors, charts, maps, OLAP Pivot Grids and more) needed to create user experiences across every platform with stability, performance and robustness.
Infragistics NetAdvantage Ultimate includes the following line of business products, which are also available individually:
Infragistics NetAdvantage Ultimate also includes the following data visualization products, which are also available individually:
Updates in NetAdvantage for ASP.NET 2010 Volume 3
- Office 2010 Style - NEW!
Give all ASP.NET controls the Office 2010 Blue Theme for a modern look and feel that will make your application fit the expectations Microsoft Office 2010 application users have. - WebDataGrid - Enhanced
Column Summaries - Displays calculated or aggregated columns to end users that you can customize. When exported to Microsoft Excel, the built-in formulas are converted to Excel formulas. - WebDataGrid - Enhanced
Selection Persistence - When using load on demand with features like paging and virtual scrolling, the data grid remembers the user’s existing selection with a single property setting. - WebDataGrid - Enhanced
Row Selectors - A new, stylable visual element can be used to highlight selected rows. - WebDocumentExporter - NEW!
Using the new WebDocumentExporter and Infragistics.Documents compiled assembly, you can export data grids to Adobe PDF and Microsoft XPS file formats with a single line of code. - WebDataMenu - Enhanced
Smart scrolling behavior is enabled when menu items cannot fit in the specified height (or width), and when the browser window is too small to show them all. - Performance Optimizations
WebDataGrid, WebHierarchicalDataGrid, WebDataTree, WebDropDown, WebDataMenu, WebExplorerBar, and WebImageViewer - Optimized Collection State
Serialization of collections is avoided during AJAX callbacks, which results in a much faster user experience. - Minified CSS
Stripping whitespace that made CSS classes more human-readable has made them more efficient now for machines to read and process. - GZip-Compressed CSS
Compressing CSS with GZip compression trims down the bandwidth needed to download stylesheets. - Version-Free Assembly Names
A set of compiled assemblies are now provided without the version and CLR tags, which allows you to more quickly and easily upgrade your ASP.NET applications by just swapping assemblies. - Infragistics.Excel - Enhanced
New Office 2010 File Support for ExcelML files allows you to export the contents of both the WebHierarchicalDataGrid and WebDataGrid into the latest version of this widely-used spreadsheet file format.
Updates in NetAdvantage Silverlight/WPF Line of Business 2010 Volume 3
- Office 2010 Style - NEW!
Give all WPF line of business controls the Microsoft Office 2010 Blue Theme for a modern look and feel. - xamRibbon - Enhanced
New support in the WPF ribbon allows you to deliver the usability improvements of the Microsoft Office 2010 ribbon user interface with your own WPF line of business applications. - Office 2010 Scenic Ribbon
New scenic ribbon now with an Office 2010 style gives you the ability to create rich applications that have improved ease-of-use. - xamSchedule - NEW!
Microsoft Outlook 2010-style scheduling to your WPF line of business applications with this complete set of stylable scheduling UI controls and extensible data connectors. - Complete Scheduling Solution
xamSchedule includes rich scheduling functionality like multi-day and multi-resource views at one time, customizable Office 2010-style dialogs with an optional ribbon user interface, reminders, and a recurrence engine that supports a superset of recurrence rules exceeding what is possible in Outlook 2010. - Day View
xamDayView gives users the ability to visualize appointments like in a day planner, on a per-day basis or a series of multiple days that can include the work week, calendar week, or any discontinuous date range. - Month View
xamMonthView mimics the month view calendar of Outlook 2010 to allow users to visualize their appointments, including multi-day events, on the timescale of an entire month. - Schedule View
xamScheduleView creates the new horizontal time axis view of a schedule that was new to Outlook 2010. This view enables users to make quick visual comparisons between two or more schedules. - Data Manager
xamScheduleDataManager serves as a single controller that manages calendar setting coordination across the multiple views supported by xamSchedule. - Data Connector
An extensible data connector design pattern features pre-built connectors for data binding activities, resources and calendars to generic lists including Microsoft SQL Server®, Observable Collections, etc., and a WCF connector. - xamDataTree - NEW!
Comfortably handle tens of thousands of tree nodes with this data bound tree view built for blazing speed over an unlimited set of hierarchical data. - Infinite Depth
xamDataTree can nest tree nodes to any level of depth. Instead of defining a template for each tree level, you define node layouts that can target a particular Type of tree node, and apply them to any level of depth within the tree. - Multiple Kinds of Child Nodes
As a direct consequence of the new node layout architecture, you can have two or more kinds of tree nodes as children for any parent tree node. - Drag and Drop
Users can edit tree nodes, and you can define your own control template to customize the editor that they will use. - UI Virtualization
xamDataTree virtualizes tree nodes so they only take up system resources when they need to be displayed to the user, giving it lightning-fast responsiveness. - Checkbox Nodes
One or more tree nodes can be selected at a given time through checkboxes next to each tree node. - Node Line Connectors
You can customize every aspect of the appearance, right down to the styling of line connectors between parent and child tree nodes.
Updates in Infragistics NetAdvantage for Windows Forms 2010 Volume 3
- Office 2010 Style - NEW!
Give all Windows Forms controls the Office 2010 Blue Theme for a modern look and feel that. Additionally, on seventeen controls there is a convenient enum property setting you can use which will enable them to display an Office 2010 Blue Theme appearance both at run-time and design-time. - WinToolbars - NEW!
New support in the Windows Forms ribbon UI allows you to deliver the usability improvements in the Microsoft Office 2010 ribbon with your own Windows Forms applications. - Office 2010 Scenic Ribbon
New scenic ribbon now with an Office 2010 style gives you the ability to create rich applications that have improved ease-of-use. - Microsoft Office Application Menu 2010 (also known as Backstage)
Microsoft designed their Microsoft Office Application Menu 2010’s functionality to give users easy access to the task-centered functions of an application. - Infragistics.Excel - Enhanced
New Office 2010 file support for ExcelML files allows you to export the contents of high performance WinGrid into the latest version of this widely-used spreadsheet file format. - Windows Messaging Support - NEW!
All Infragistics standalone editor controls can now process numerous Windows® OS messages which allows them to respond just like native controls to changes in the Windows environment.
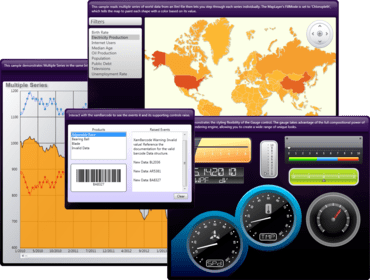
Updates in NetAdvantage for Silverlight Data Visualization 2010 Volume 3
- Microsoft Office 2010 Style - NEW!
Make any Silverlight data visualization control match the look and feel of the latest version of this popular business productivity software suite from Microsoft. Office 2010 Blue Theme is now supported on all Silverlight data visualization controls. - Infragistics.Excel - Enhanced
Read and write ExcelML spreadsheet files with support for the new Microsoft Excel 2010 file format in the Infragistics.Excel compiled assembly. - xamPivotGrid - Enhanced
Show multi-dimensional data from OLAP servers that use the open standard, XMLA. New support for providing network credentials to logon to authenticated XMLA data sources. Optimized XMLA data source designed specifically for the needs of connecting to SAP data sources using XMLA. - xamDataChart - Enhanced
New Polar Axes allow the data chart to depict data that’s best shown in a chart with polar coordinates such as the crystallographic texture of materials or a customer’s satisfaction with a good or service. - xamTreemap - NEW!
Custom Value Mappers like the ValueMapper and RangeValueMapper enable you to modify node properties based on your own custom ranking criteria, highlighting those nodes that you want the user to spot immediately (for example, you can change the background brush that fills all nodes whose revenue was less than a certain amount.) Root Node enables you to more easily traverseall of the nodes within your Silverlight treemap. - xamBarcode - NEW!
Support for generating QR Codes, an immensely popular matrix (2-D) barcode symbology in Japan and with smart phone users worldwide. - xamMap - Enhanced
Improved performance when panning and zooming complex, multi-layer maps with a Window Animation Mode setting that you can configure to adjust the degree of animation that takes place.
Updates in NetAdvantage for WPF Data Visualization 2010 Volume 3
- xamMap - NEW!
Official release of the xamMap control for WPF Data Visualization so you can map anything and everything from geographic / geo-spatial mapping data. Multi-scale image source support is a new feature of xamMap that allows your application’s end users to drill down into map image sources that provide additional levels of detail. Improved performance when panning and zooming complex, multi-layer maps with a Window Animation Mode setting that you can configure to adjust the degree of animation that takes place. xamMap supports the widely-available Shapefile file format, and OpenGIS standards-based SQL extensions for geospatial data. - Microsoft Office 2010 Style - NEW!
Make any WPF data visualization control match the look and feel of the latest version of this popular business productivity software suite from Microsoft. Office 2010 Blue Theme is now supported on all WPF data visualization controls. - Infragistics.Excel - Enhanced
Read and write ExcelML spreadsheet files with support for the new Microsoft Excel 2010 file format in the Infragistics.Excel compiled assembly. - xamPivotGrid - Enhanced
Show multi-dimensional data from OLAP servers that use the open standard, XMLA. New support for providing network credentials to logon to authenticated XMLA data sources. Optimized XMLA data source designed specifically for the needs of connecting to SAP data sources using XMLA. - xamDataChart - Enhanced
New Polar Axes allow the data chart to depict data that’s best shown in a chart with polar coordinates such as the crystallographic texture of materials or a customer’s satisfaction with a good or service. - xamTreemap - NEW!
Custom Value Mappers like the ValueMapper and RangeValueMapper enable you to modify node properties based on your own custom ranking criteria, highlighting those nodes that you want the user to spot immediately (for example, you can change the background brush that fills all nodes whose revenue was less than a certain amount.) - xamBarcode - NEW!
Support for generating QR Codes, an immensely popular matrix (2-D) barcode symbology in Japan and with smart phone users worldwide
For more information visit:
http://www.infragistics.com/about-us/press-room/press-releases/netadvantage-ultimate-2010v3-release.aspx
About Infragistics
Infragistics has been a market leader in the presentation layer components industry for over 18 years. With a comprehensive portfolio of multi-platform Enterprise Software products and services, it has achieved global reach in nearly every Fortune 2000 company. Infragistics empowers developers to build and style great application user interfaces for Windows Forms, ASP.NET, WPF and JSF, and additionally offers user interface test tools, support, training and consulting services.
Infragistics NetAdvantage provides the most comprehensive set of components for quickly building and styling commercial class user interfaces for Windows Forms, ASP.NET, JSF and WPF applications. The company's advanced user interface controls allow developers to produce all of the familiar interfaces your users expect, such as Office 2007 UI, Windows XP, and Vista. Its controls are widely deployed for use in the hottest architectures such as Web 2.0, SharePoint and Microsoft’s Composite Applications Block (CAB). Within every NetAdvantage product, Infragistics provide global product support, source code to controls and frameworks, guaranteed multiple releases yearly of customer driven products and features and much more.